
How to ensure performance
At Nimble Initiatives, we develop a platform where speed and performance are at the very core of the product. With no legacy we can add speed as a vital metrics without compromising. But how do we measure speed and how can we collect relevant data over time? And maybe more interesting, how are we performing compared to other technologies and services?
Measuring speed and performance can be quite tricky because you often have poor insights about the end user and the environment in which the user operates. Fortunately, Google has done a great job addressing this issue by introducing CWV (Core Web Vitals) and adding CWV to their PageRank algorithm on May 28,2020. One good thing with CWV is that Google helps us collect field data, and the Core Web Vitals Technology Report makes it easier for us to benchmark our own performance. In order to make it easier to measure and compare data Google has set boundary values for what’s a good performance, a performance in need of improvements and what’s a bad performance.
Today CWV conducts these three metrics:
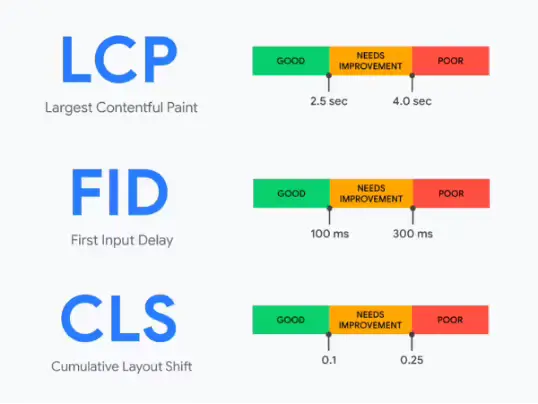
LCP (largest contentful paint): The amount of time to render the largest content element visible in the viewport, from when the user requests the URL. The largest element is typically an image or video, or perhaps a large block-level text element. This is an important metric because it gives to the user a fast and good page experience.
FID (first input delay): The time from when a user first interacts with your page (when they clicked a link, tapped on a button, and so on) to the time when the browser responds to that interaction. This measurement is taken from whatever interactive element that the user first clicks. This is especially important on pages where the user is requested to perform any action.
CLS (Cumulative Layout Shift): CLS measures the sum total of all individual layout shift scores for every unexpected layout shift that occurs during the entire lifespan of the page. The score is zero to any positive number, where zero means no shifting and the larger the number, the more layout shift on the page. This is important because having elements shift while a user is trying to interact with the page is a bad user experience. If you can't seem to find the reason for a high value, try interacting with the page to see how that affects the score.
These measurements are evaluated against the following boundary values set by Google:
At Chrome Dev Summit 2021 Google revealed some new performance metrics for potential inclusion in Web Vitals down the road. They are: * Responsiveness – the idea is to better capture the end-to-end latency of individual events and offer a more holistic picture of the overall responsiveness of a page throughout its entire lifetime * Smoothness –this metric will capture how smooth content animations and scrolling works on the site
Core Web Vitals Technology Report
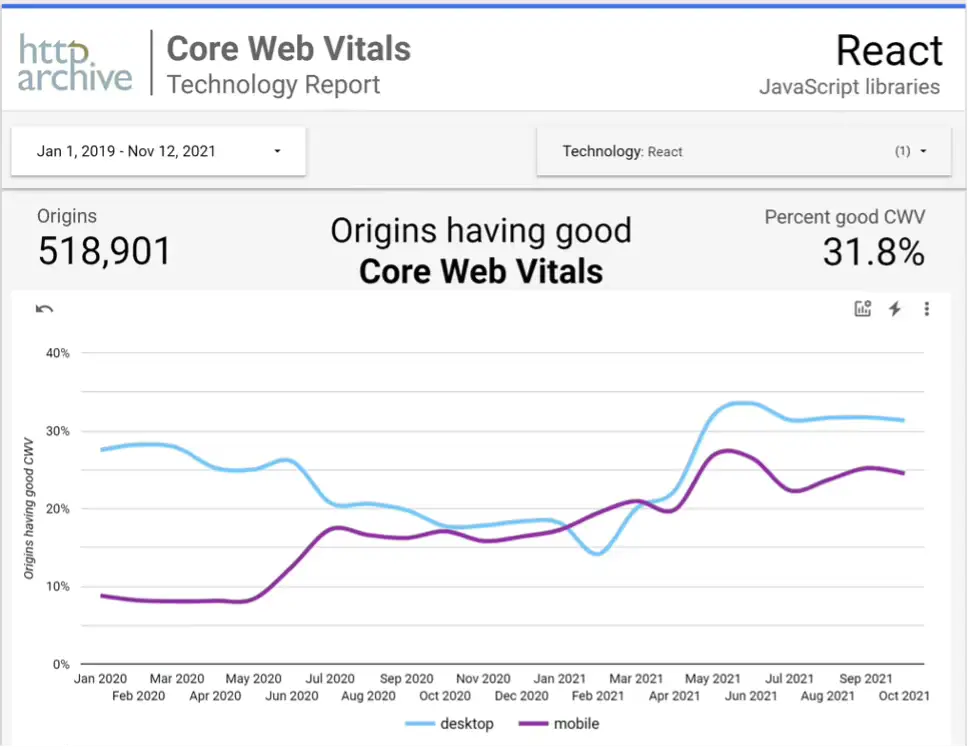
Let’s check the performance metrics for React which is one of the most common JavaScript libraries on the market. Out of 518901 tested 31,8 % having good Core web Vitals on desktop, and 24,5 % having good Core web Vitals on mobile. Even that it is possible to create a fast web site using React it’s sad to see that 3 out of 4 fail delivering a good user experience on mobile devices.
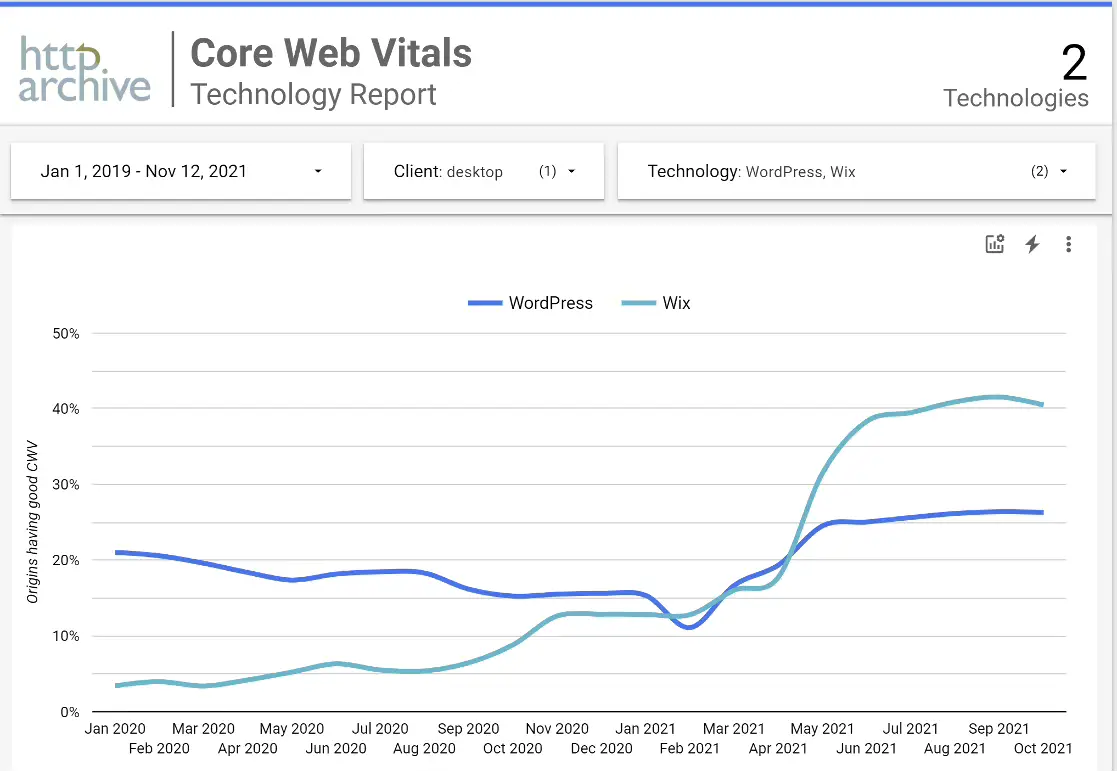
If we check with some of the most common CMS, the picture is almost repeating itself, but the vendors are working hard for hitting better scores. In this case Wix has done huge improvements this year. And once again, you can’t determine by this graph which CMS delivering the best Web Vitals. This is only a summary, and we believe you can build a well performing website using any CMS, but at the same time it puts a finger on the ecosystem related to each CMS. Also note that this figures doesn’t measure the editor environment, that is a completely different story.
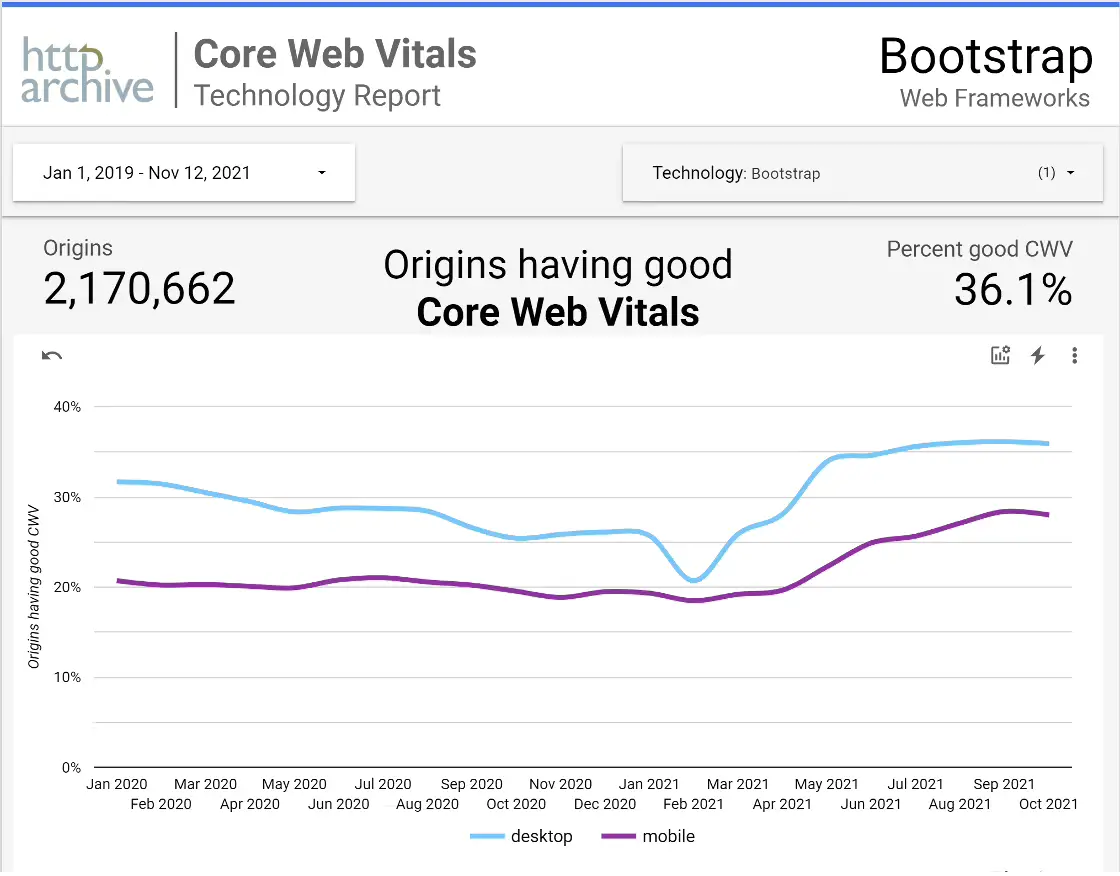
Bootstrap is another common framework used by millions around the world. 36,1 % on desktop and 28 % on mobile are having a good experience.
What's our take on Core Web Vitals?
In total Core Web Vitals are good metrics. When building our own platform, we are constantly monitoring our Core Web Vitals. It’s one out of many tests we do constantly. But a platform’s performance will only take you so far, you still need to build your own solution based on any platform. That’s why one of the keys for us is to never hinder developers in any way from doing their own magic. Our biggest take on performance spells knowledge and that’s why you will be able to use whatever technology you like when building your solution using our platform.
Conclusion
Google is making the web industry invest in the know-how of user experience, by defining the standard for good performance and adding boundary values to the metrics, including them into their PageRank algorithm. They give us the tools to learn and the ability to benchmark our progress with colleagues in the market. But remember, even a good technology/platform can be messed up so make sure to test your performance continuously or work with a well trusted partner.