Journal

Thoughtful stories and interesting conversations
Subscribe to updates · Follow us on Twitter.

Picking it up a notch

We have big plans for this year and are ready to take things to the next level. With this in mind, we are happy to introduce our latest addition to the team; David Tellander. We have a long history with David and he is undoubtedly one of the smartest people we know, so we couldn't be more excited to have him onboard. David will make a great impact on our product development, but he will also be in charge of Operations making sure everything runs nicely and smoothly within our cluster.

Creating our method

We're getting close. The release of our first initiative is now just around the corner. It's an early release and only available for a chosen few, but we couldn't be more thrilled to finally give others a glimpse of what we've been cooking up and gather some valuable feedback.

Ever since we began operations nearly two years ago we have been working on realizing the idea of @marcus_lindblom, the source of the initiative. We made the decision early on to take things slow and steady, instead of bringing in investors right away and going full throttle. So to keep the lights on and fuel our efforts, we decided to combine the development with offering our services to others part-time.

This definitely presented us with some challenges, like figuring out how to keep our focus while juggling multiple tasks. And therefore we had to come up with a way of work that is fast and flexible yet thorough enough to ensure high quality in our product. And we find it hard to believe that we are the only ones facing this kind of challenge so we thought we would share our method with you all.

Development cycles

When starting a development cycle we want nothing but the best conditions for our team. We want the team to be able to create momentum and focus on the important tasks ahead. This is hard. Life is busy. But we try to cancel as many unrelated meetings as possible and make sure everyone is finished with any previous work and obligations before starting the cycle. After each cycle, there is a cool-down period where team members have the time to catch up with other work.

We also don't set a fixed amount of days in each cycle. We scope work for a 1-2 weeks period depending on how busy our current schedule is but we are always aiming for finished and shippable work before ending the cycle. All because we have a strong belief that task switching and leaving work unfinished is bad for both your stress level and our product's progress.

Each cycle follows the same routines. We're not a big fan of long meetings, although we could talk for hours if given the opportunity, but we do need to do some proper planning before jumping straight into the code. Therefore we have a few cycle routines that we try to follow in order to get the work done in the most efficient way:

  1. Think it!

  2. Sketch it!

  3. Engineer it!

  4. Build it!

  5. Ship it!

1. Think it!

The Briefing We always start with a short briefing to get everyone up to speed. Recap the previous cycle and discuss the most prioritized tasks and features for the upcoming one. Set a scope, make celebration plans, and move on! Don't linger but take the time to make all necessary preparations and break down tasks to a reasonable size.

2. Sketch it!

At the drawing board In order to make sure everyone has the same idea of what to expect from a feature we need to create some kind of visualization. Regardless if it's a full-blown design, mockup prototype, or just a few lines drawn to a piece of paper it will help create an alignment in the team. A few things may very well change along the way. You should probably count on it. But it's not that big of a deal, the most important thing is that we are all on the same launch pad when it's time for blastoff.

3. Engineer it!

The Blueprint Once we know the WHAT it's time to decide the HOW. By creating a very rough technical blueprint of the feature we agree on how things will work, what techniques to use and what unknowns that must be further investigated. It's also important to consider what other parts of the application may be affected or could be utilized. The most important thing when creating this blueprint is to spark team collaboration and benefit from the combined team experience and expertise before writing the first lines of code.

4. Build it!

While developing we don't want to waste any time getting the feature out to our users. User feedback is crucial and let us know if we're on the right track. So we want to maintain a good speed and avoid getting stuck on details. Therefore we follow these, perhaps familiar to some of you, principles when developing a feature; Make it work, Make it fast and Make it beautiful.

Each principle defines a milestone that should have a shippable outcome and we always aim to include all three principles in the same cycle but depending on the feature's size we may have to revisit the feature later on to fulfill the rest of the principles. The feature is never considered done before we have worked through all three principles.

Make it work

With this principle in mind, we expect a shippable feature that is robust, gets the job done, and checks all the criteria of the feature spec. It may not be the fastest version of itself, the code could still use some cleanup and there could still be some details or cosmetics missing. But at the end of the day, we should be able to introduce the new feature to our users.

Make it fast

Performance is important. Really important. And with this principle in mind we try to optimize the feature for speed. We want a lightweight impact on the application and a feature that feels natural and easy on the user. Lightning fast. No spinners. No waiting.

Make it beautiful

We want a feature to feel almost magical. We always try to walk that extra mile and surprise the user with super smart features that will make their work fun, easy and powerful. We also want clean code, a clean interface, and not too many WTFs on the code review.

5. Ship it!

Make the world know The most exciting part of our work is when we are able to release new features or improvements to our users! We try to automate as much as possible of the deployment to make things run smoothly and without hassle. This way we can deploy often and easily roll back if something went wrong. Since we aim to release every cycle some features may not be 100% done, in those cases we use feature toggles to try out the feature only on a small group of users. During this phase, we also create a change log and update the documentation for everyone to see. It's also a great opportunity for us to share any insights and gather ideas for future blog posts.

Summing it up

We believe that using this method allows us to maintain a balance of speed and structure. It helps us to focus on what is important without losing sight of the bigger picture. Additionally, we use roadmaps for long-term planning and a triage system for managing ideas, perhaps I may delve deeper into these topics in a future blog post.

I hope you found this blog post interesting and perhaps even sparked some new ideas for you. If you have any questions or would like more information, please do not hesitate to reach out to us. We are always delighted to share our insights and ideas with our readers.

Why are some websites performing bad on mobile devices?

Recently Google released a very interesting new performance metric called INP (Interaction to Next Paint). INP puts focus on responsiveness and logs the latency of all interactions throughout the entire page lifecycle. It simply checks how fast a site responds to user inputs and gives the user visual feedback, something which is crucial to the user experience.

90 % of a user’s time on a web page is spent after it has loaded, which makes this metric a key value for all web site owners if you want to deliver a good overall user experience.

What is a good INP Value?

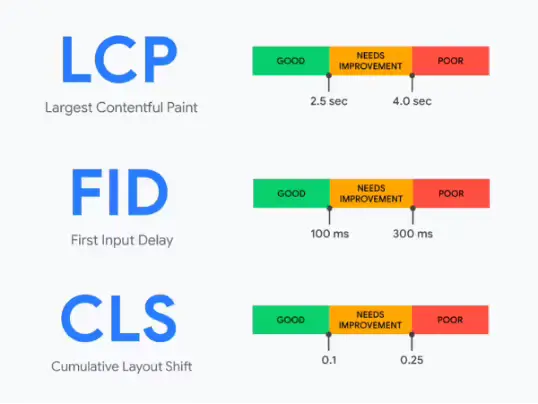
First, you need to know that INP aims to calculate an overall interaction latency by selecting one of the single longest interactions when a user visits a page. As in every other Core Web Vitals, there are limit values that ranks as good performance, performance in need of improvement and as a bad performance.

  • INP below 200 milliseconds ranks as a good performance

  • INP above 200 millisecond milliseconds but below or at 500 milliseconds means that your page's responsiveness needs improvement.

  • An INP above 500 milliseconds means that your page has poor responsiveness.

So, now when we know what INP is and what a good score is, it’s time to check how different technology and CMS affects INP on different devices (desktop and mobile).

Before we begin, I want to clarify that we benchmarking the actual website built with a CMS, not the CMS editor view itself.

INP on a desktop

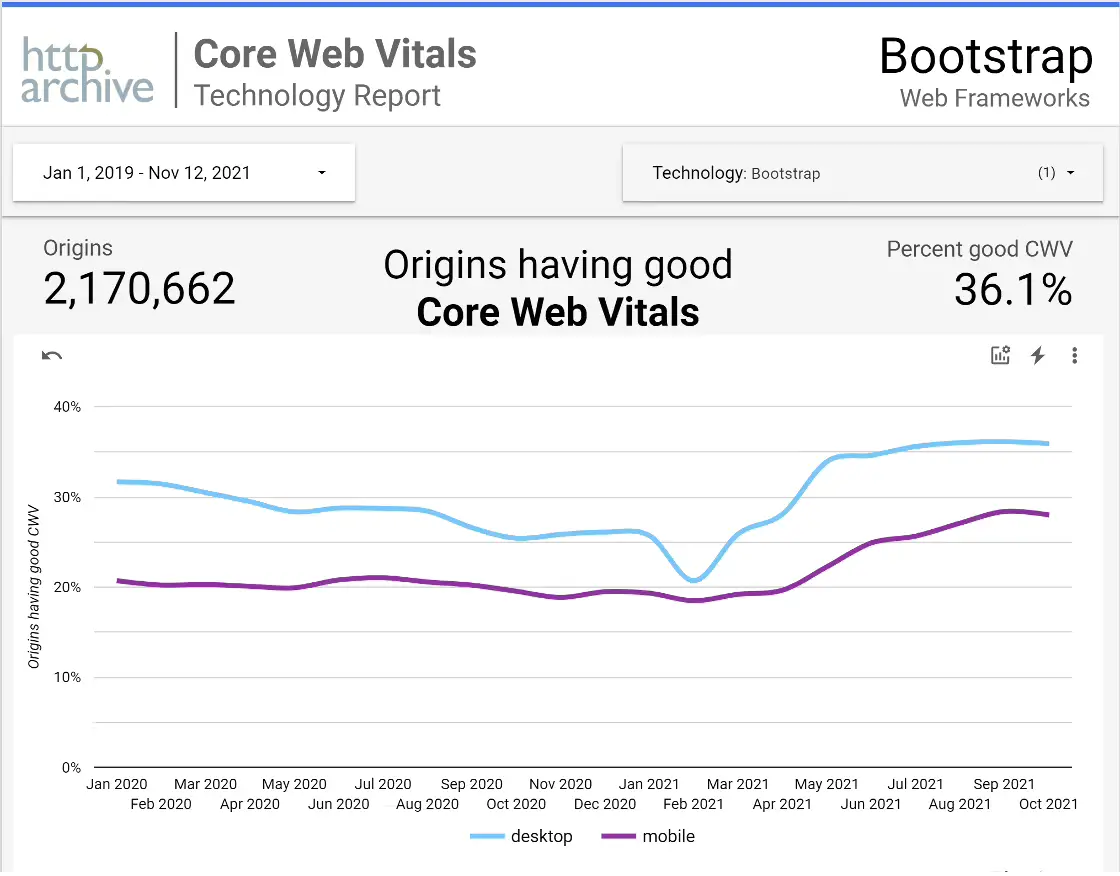
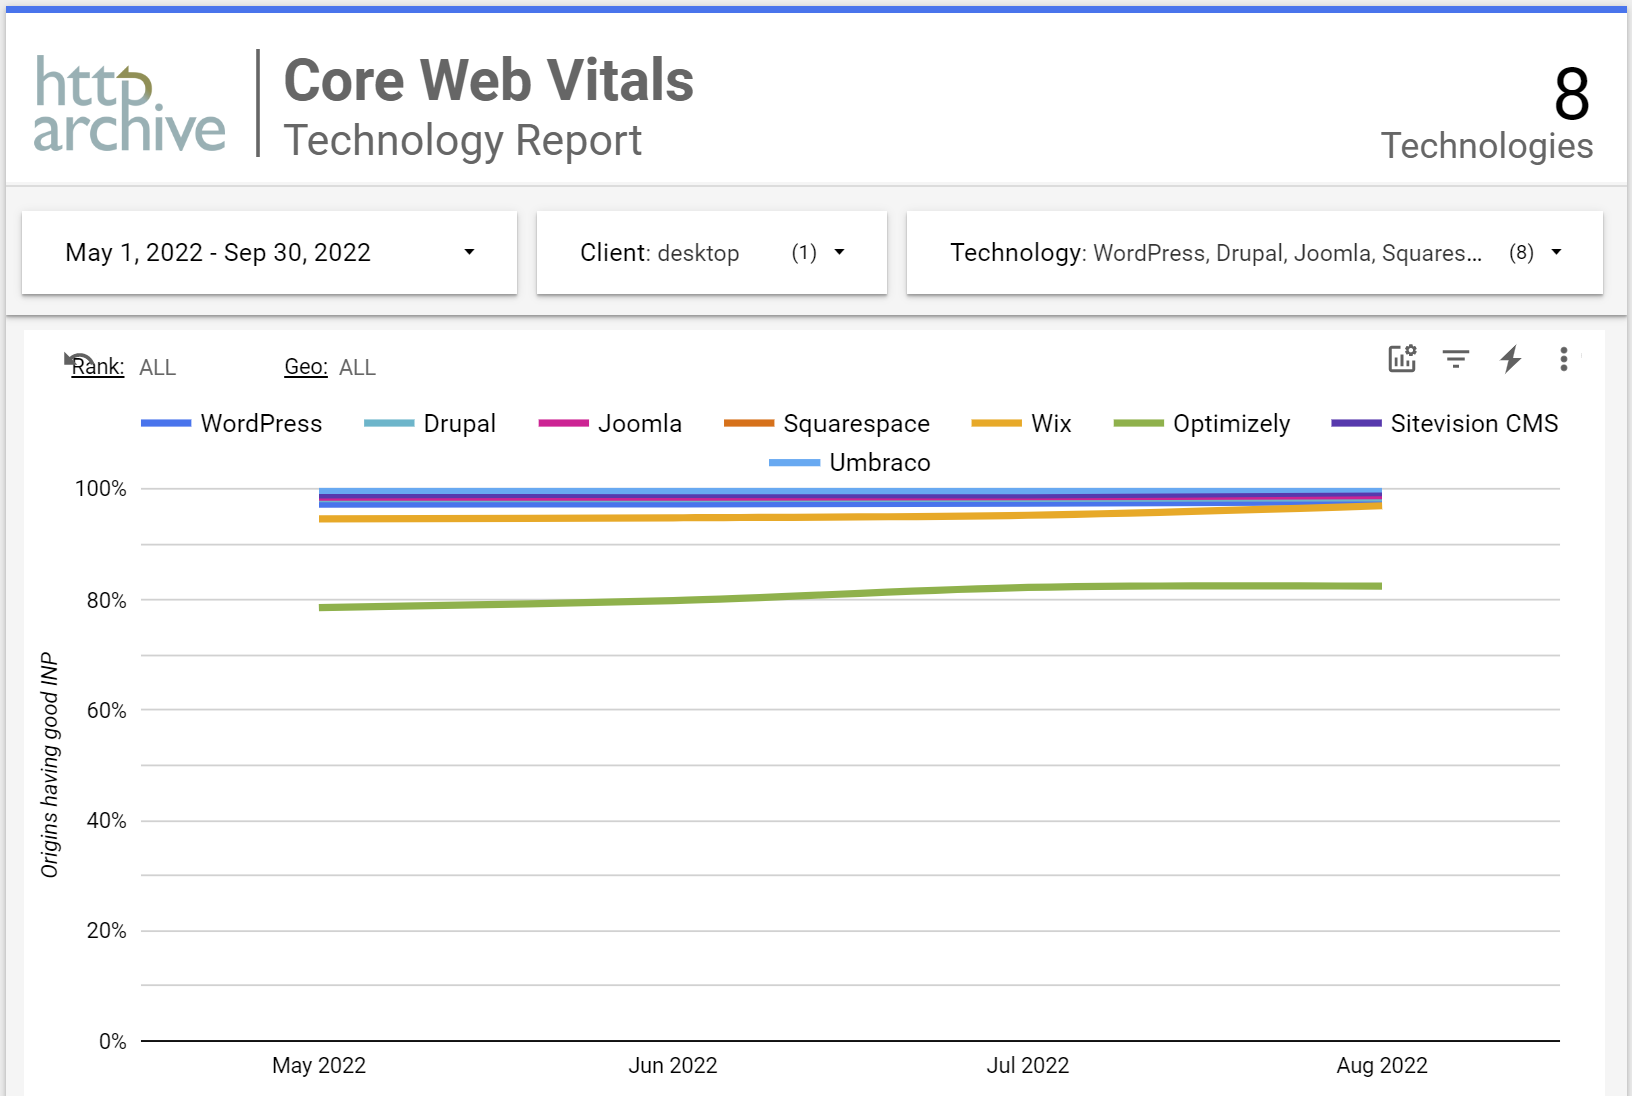
Let’s start by comparing different CMS on desktop by using Core Web Vitals technology report.

First, let’s look if we can find any difference between a traditional CMS compared to a headless CMS on desktop. Below you see some of the most common CMS brands in the world and some local Swedish brands as well. As you can see, they all perform well, and you notice no big difference between them. If you are a bit harsh, you might say that Optimizely has some issues to work on.

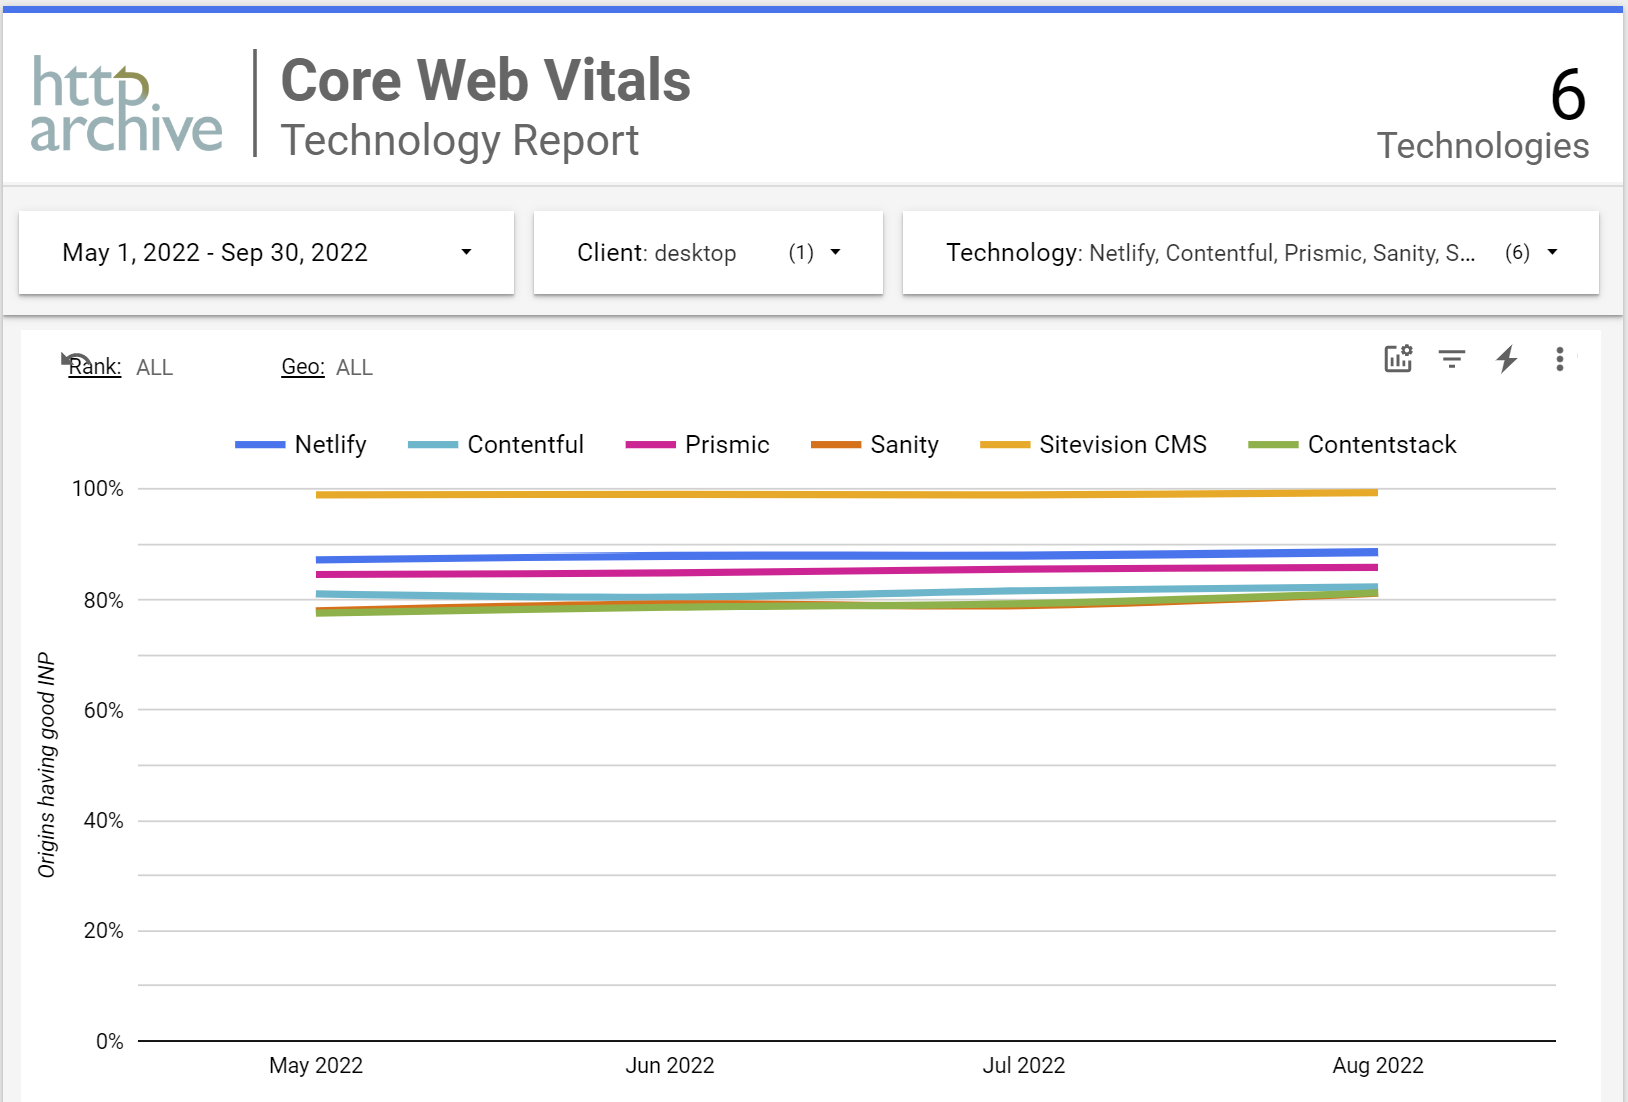
Let´s do the same check with some of the most common headless CMS and compare it with the best traditional CMS in the first test (Sitevision CMS). As you can see, we get a slightly poorer performance from the headless CMS, but no one is dropping too much to call it a bad performance. Our best guess on this small drop in performance is that more work is being done on the client side when it comes to rendering and collecting data through APIs. And a wild guess is that websites built on headless technology, more often uses different modern JavaScript frameworks like React and Vue.

Even though we see some small performance differences between traditional CMS and headless CMS, most of all benchmarked CMS are doing well when it comes to the INP metric. Or you might say that the people who are creating the websites are doing a good job.

INP on mobile devices

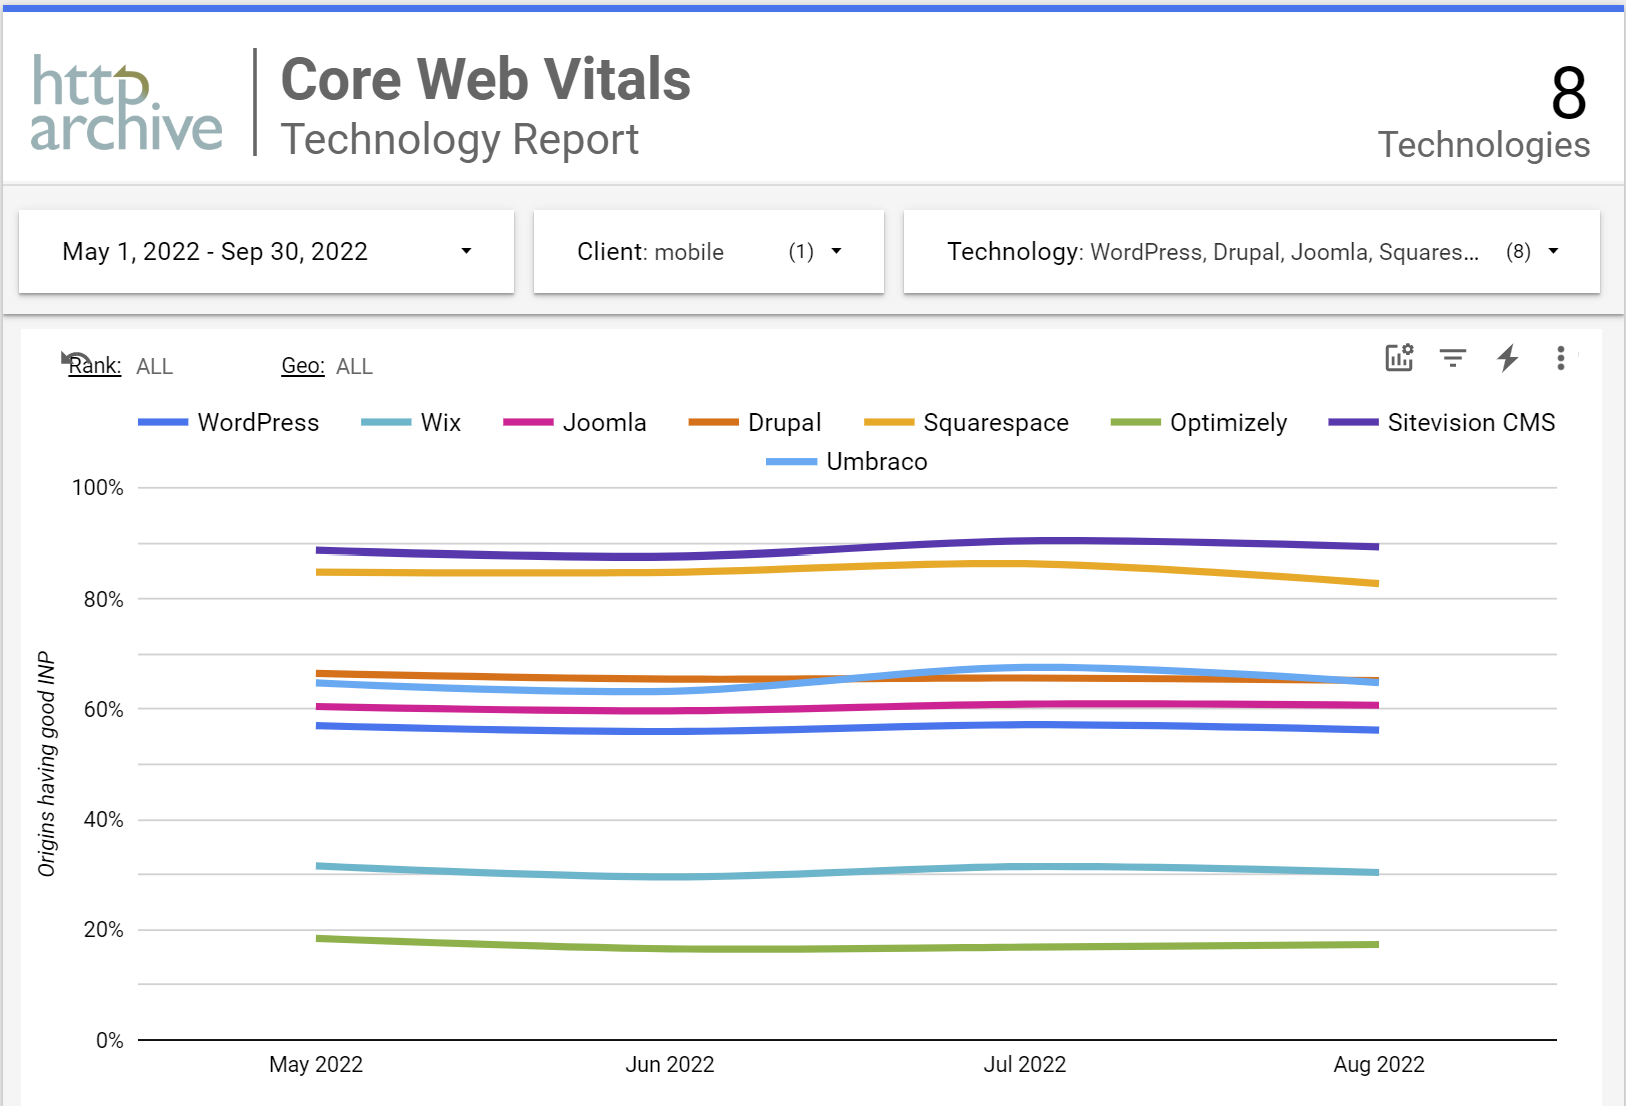
Let´s do the same comparation for mobile devices and check if we can find any big changes in performance.

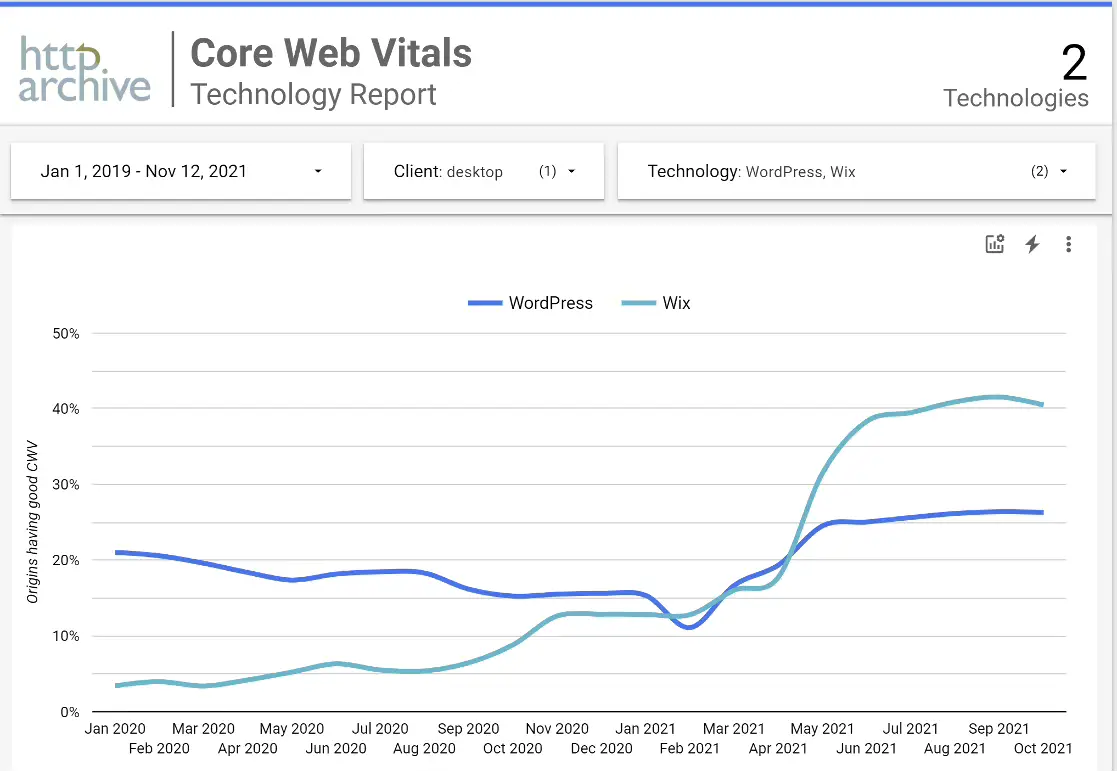
As you can see below, we get a completely different graph comparing to desktop and we can confirm that Wix has a big challenge when it comes to INP on mobile devices. And we see that WordPress, who is the most common CMS in the world, drops from almost 100 % to 60 % on mobile.

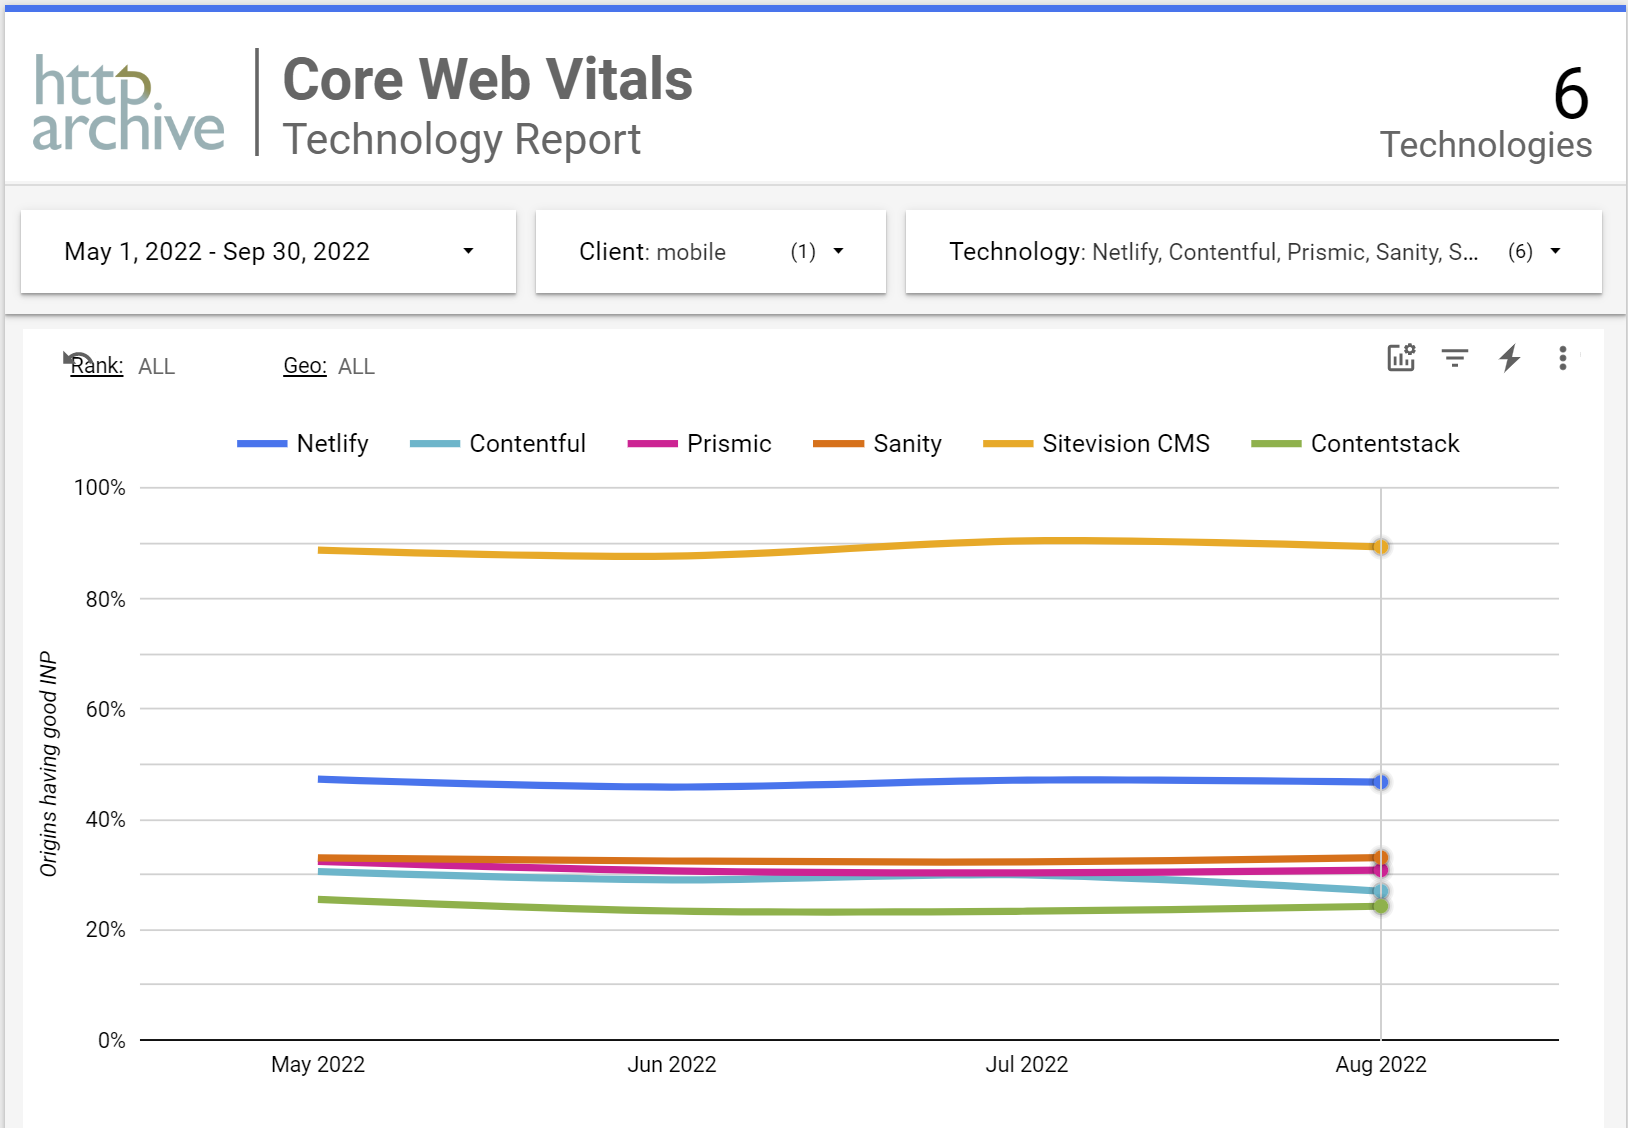
So, what´s happening with headless CMS when we shift to mobile devices? As in previous comparation we added the best performing traditional CMS on mobile, which in this case is the same as we added on desktop (Sitevision CMS). As we can see in the graph below, we have a big drop in performance when it comes to INP in headless CMS. In this case Contentstack has the biggest challenges but no one is reaches above 50 % in this example.

So why are we seeing such a bad “user experience” on mobile devices?

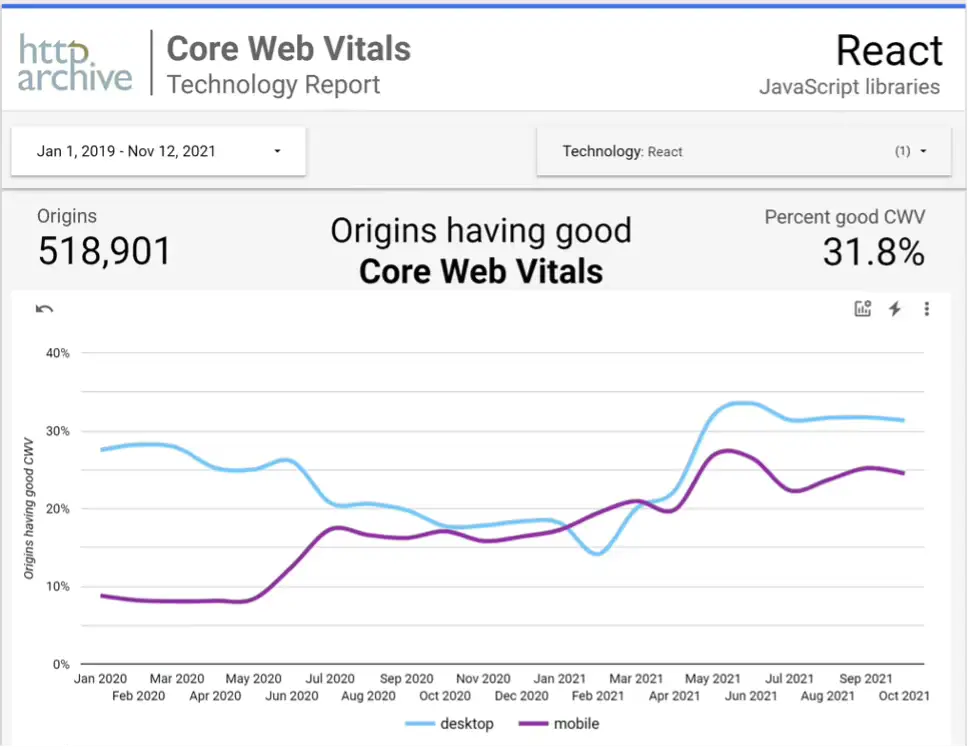
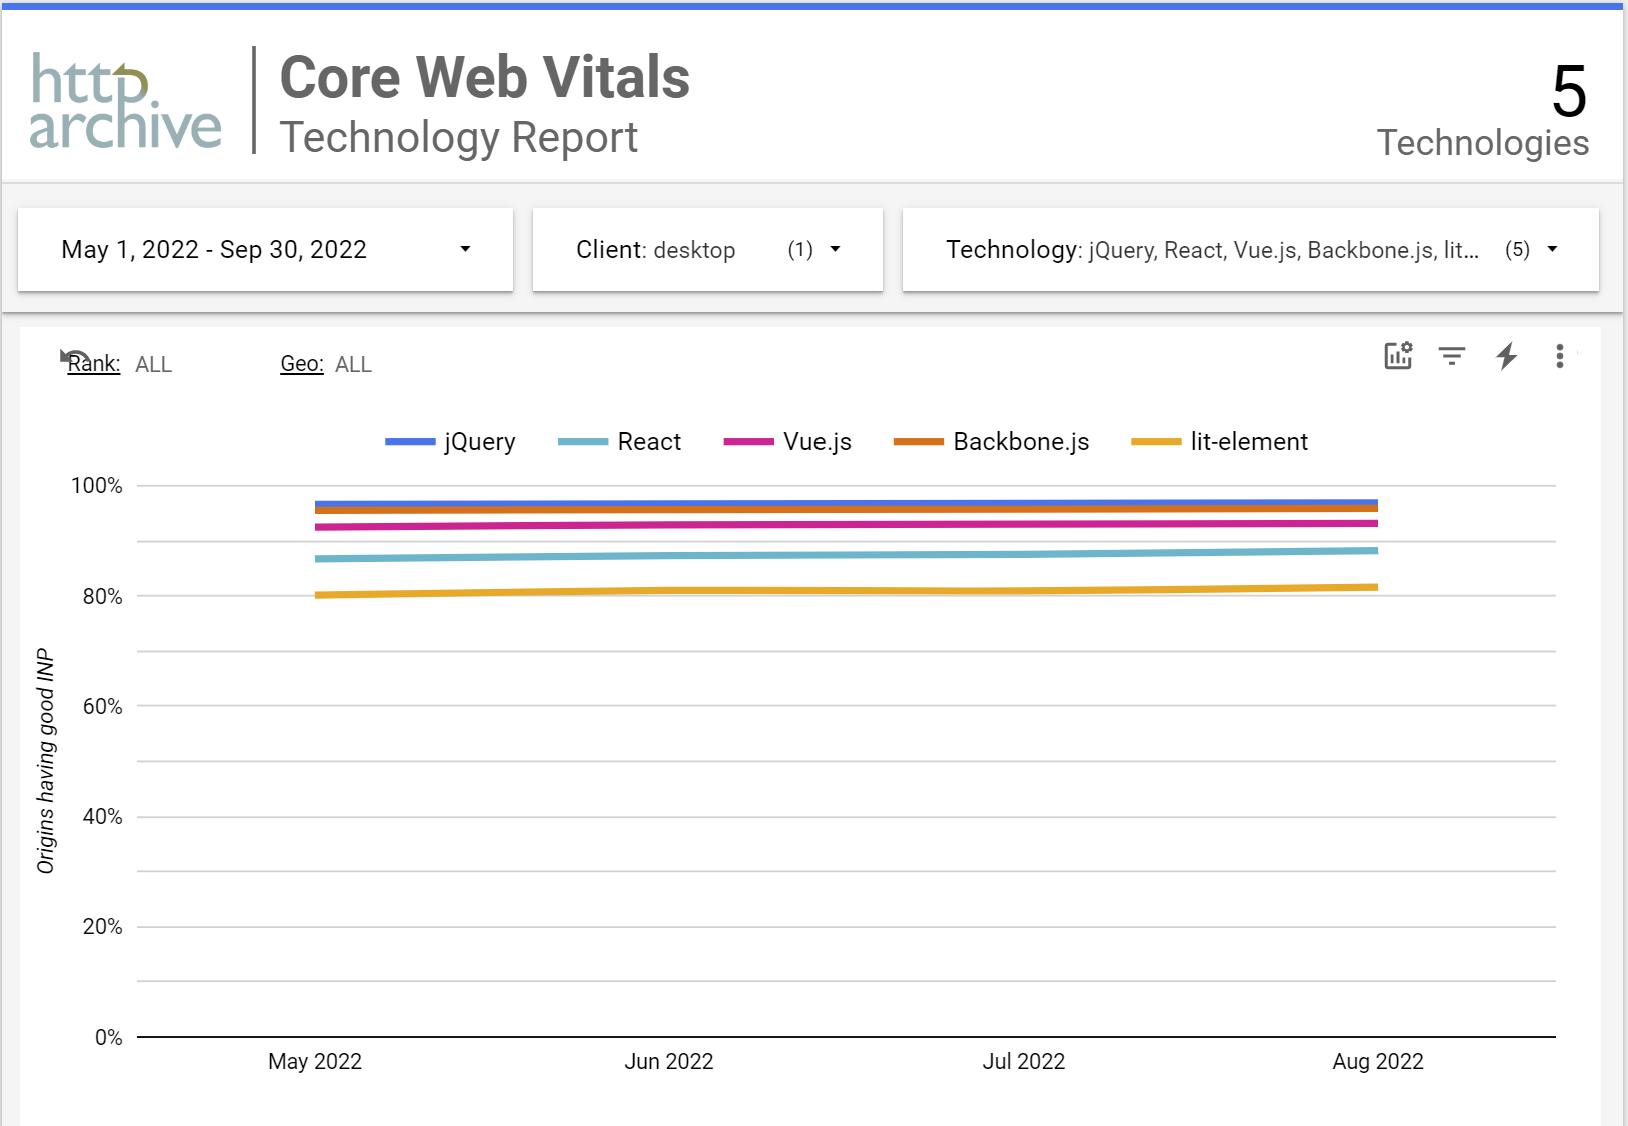
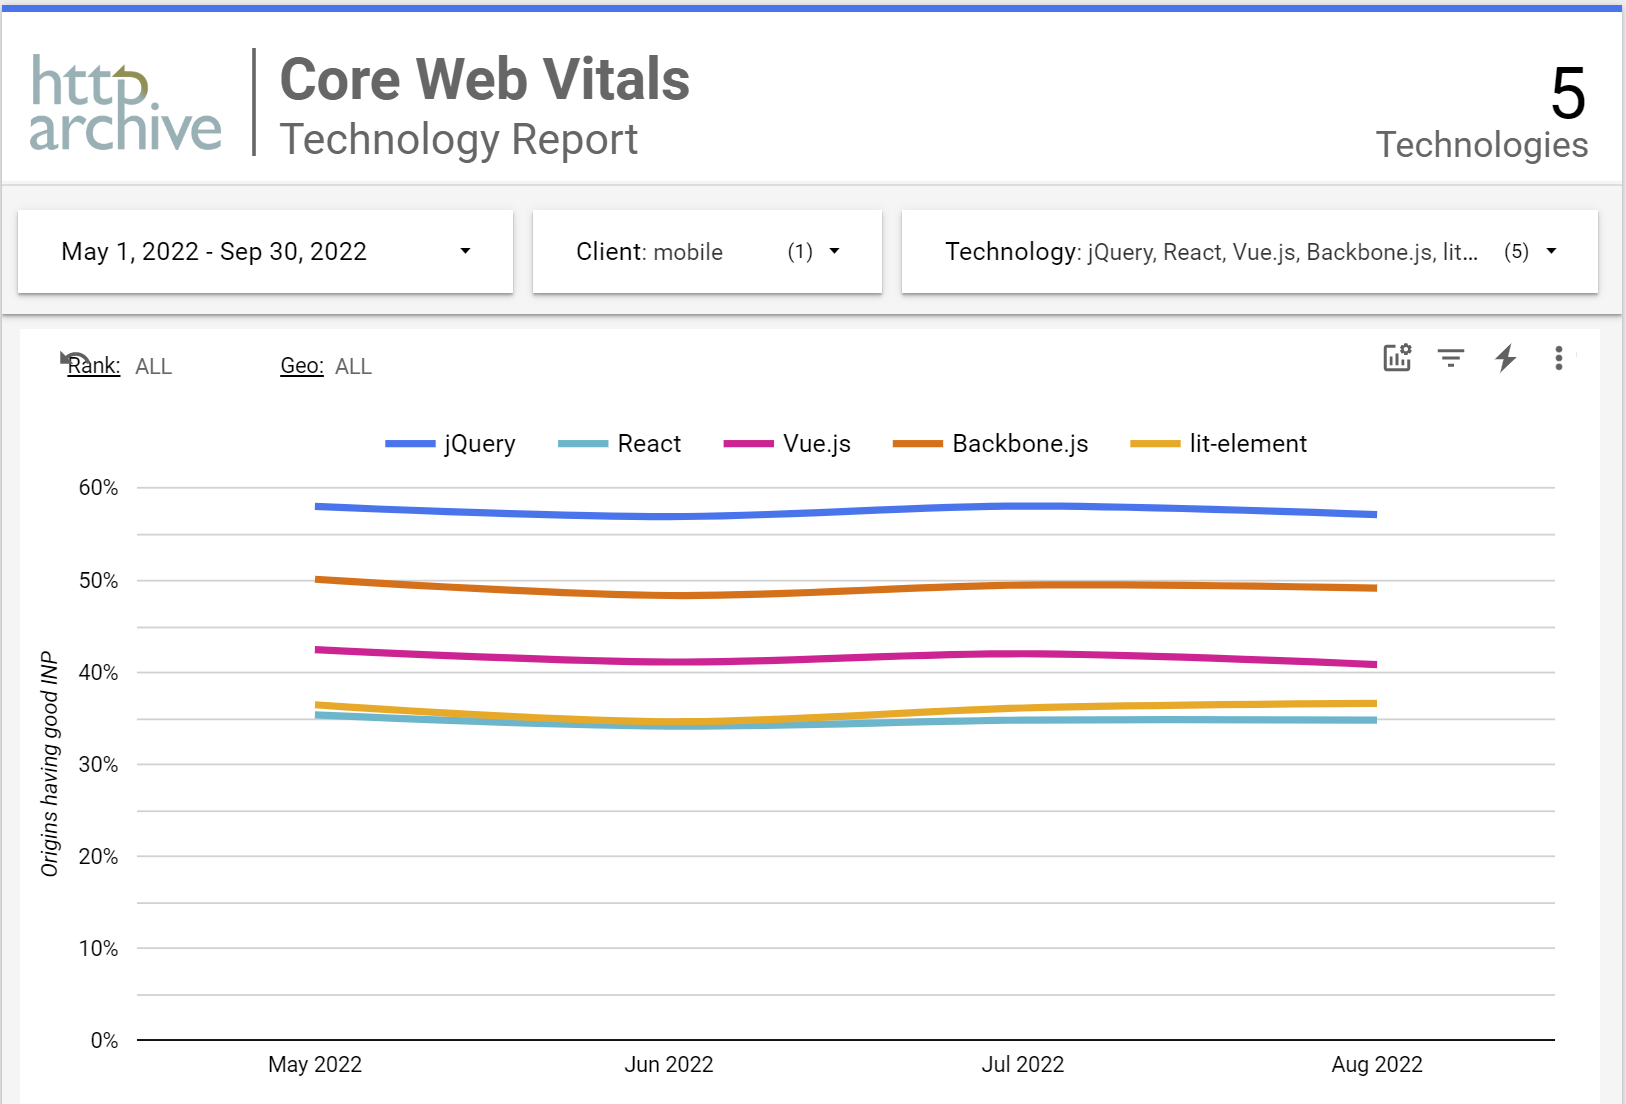
Let´s start by checking if we can find out what´s slowing down the mobile versions. As we mentioned earlier, we guessed that headless CMS are using more modern JavaScript Frameworks like React and Vue for enriching the user experience, so let’s check if we can see any parables by investigating how different JavaScript Frameworks affect INP on desktop and mobile.

We can clearly see the same pattern when we compare different frameworks on desktop and mobile in the graphs below. By looking at the different graphs, we believe it´s not a wild guess to assume that this kind of frameworks has an impact on INP performance on mobile, but still, it´s just a guess.  Another thing we noted during the comparation between different frameworks was that you cannot simply do a benchmark like this and chose a framework based on the numbers below and hope to get the best INP score. It´s much more complex. You need to consider what framework that suits you best when it comes to purpose and knowledge. To exemplify, we added lit-elements which are known to be one of the fastest frameworks on the market and as you can see below it performs terribly bad.

The INP metric has only been available in Core Web Vitals technology report for a couple of month and site owners are seeking answers to this behavior on mobile devices. Google got this question from a user and their answer was quite clear and, in some way, obvious.

“Desktop devices tend to be orders of magnitude more powerful than mobile devices, and so they can process code (both app code and browser code) much faster, which leads to faster response times. Mobile devices tend to be much slower, and so the same page running the same code will usually report longer response times for the same types of interactions.”

Another reason for mobile devices performing bad, is of course slow connections in combination with large amount of data transfer, so be sure minimizing the amount of data by using modern image formats, remove unused JavaScript and minify the scripts you are using. Then, if possible, put your scripts in the bottom of the page to prevent scripts from blocking calls which may delay the page rendering.   

But when it comes to why different framework differ in performance it´s not that obvious. You need to dig deeper into each website to find explanations but maybe one reason could be the ripeness of the framework and community knowhow that comes in to play. In other words, if you are skilled enough in any framework you will probably be able to build a fast site, at least when the user access it from a desktop.

Check your INP metric

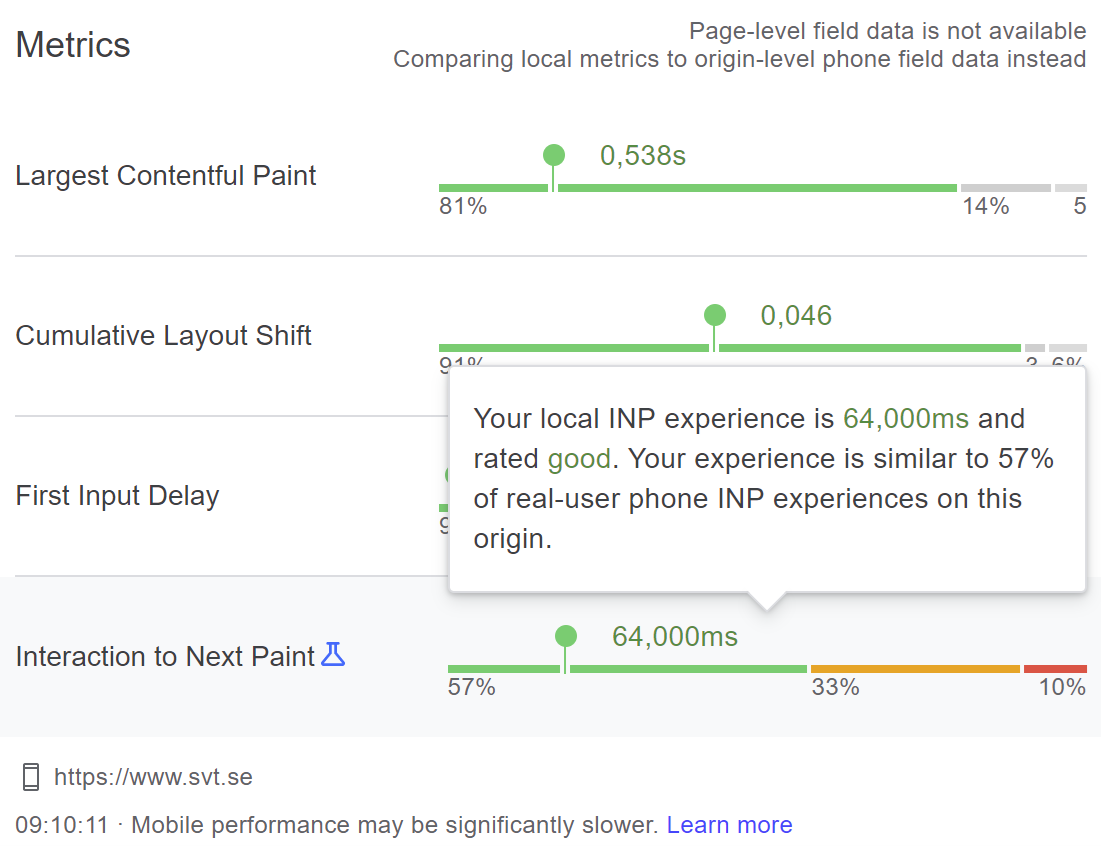
The easiest way to check your websites INP score, is by installing the Web Vitals Chrome plugin on your desktop. I recommend activating the option “Comparing local experiences to phone field data”. This option helps you get a pretty good feel for how many of your mobile users getting a good user experience, and how many of them getting a crappy one.

In the screenshot below you see how the report looks like when you activate this option on your desktop in Chrome.

If you want to get into more details about framework performance, then this public benchmark page is a good start for you. As you can see on this page, Vanilla is the right path to follow if you are searching for speed!

Framework performance

Good luck with improving your INP performance! 

Increase your site speed before you invest in marketing

A while back we talked about building a performance culture and how analysts at Portent found that conversion rates could more than double when improving Page Load Speed.

Portent recently did an updated analysis on the subject by creating a 30-day snapshot of 20 e-commerce sites (14 B2B and 6 B2C) and they got to the same conclusion - a maximum loading time of two seconds has a great impact on an e-commerce company’s revenue. And a blazing fast site that loads in just one second actually has a conversion rate 2.5x higher than a site that loads in five seconds. The updated analysis also showed that site speed in general slightly improved from the previous test back in 2019, 86 % of the tested sites had a page load speed of 5 second or less compared with 81% in 2019.

When taking a closer look at the Transaction Conversion rate for users completing a checkout, we find some interesting numbers. High performing sites (loading speed of one second or less) have a conversion rate of 3.05% while poor performing sites (four seconds or more) have a conversion rate of only 0.67%. That means that those sites must increase the number of customers starting a checkout process with 4.5x to get the same revenue on the bottom line! Wow!

So, let’s stay with that thought and do a very simple calculation on how much you would actually need to invest in marketing to get that 4.5x increase of customers. Please note that this is just a play around with numbers and not a real analysis, but we still think there are interesting insights worth noting.

Suppose you have 1000 visitors before you start the campaign. Also say you know that your customers mainly use Facebook, and you are planning for a Facebook campaign to gain more customers. We don’t want to make the calculation too complicated so assume that every new potential customer is derived from this campaign. You would have to pay, in average (January 2022), $ 0,94 per click (CPC) on Facebook so to get additional 3500 potential new customers you would need to pay Facebook $ 3 290. You need a good margin or very high prices on your products to motivate this marketing cost for only 23 new customers (0,67% x 3500).

And to have the same volume over time you need to run this campaign 24/7 in order to have the same amount of paying customers as a lightning-fast site.

But what if you actually had that lightning fast site and decided to run the same marketing campaign? That would result in a lot of increased revenue for your money. If you pay $ 3 290 and get 3500 new potential customers, you would add 107 (3,05% x 3500) new paying customers instead of those 23 if your site having a page loading speed of 4 seconds. And if your average checkout is $200 you will increase your revenue with $ 21 400 if your page load speed is 1 second, and only $ 4 600 if your site page load is 4 seconds.

As mentioned, this was just a theoretical and a simplified calculation, but I think you see the huge advantage you get with a lightning fast site.

Source

Research-site-speed-hurting-everyones-revenue

Facebook-ads-cost

Choosing the best website analytics provider

We are strong believers in privacy, in fact, our entire company is built on putting digital privacy first. In every decision we make, we always have our users on top of mind.

As a newly founded company we are still in the early stage of building an audience. We try to do so by creating and sharing content. Like any other company, we are interested in collecting data so we can learn from our users so we can take better decisions.

In the search of the best website analytics provider we stumbled upon Fathom. We liked the company, a small private bootstrapped company, just like ours, with a service they said was cookie-free, GDPR compliant and privacy focused. Another feature that caught our eyes was called EU isolation, to ensure compliance with the Schrems II ruling. We were stoked so we took the next step and started a seven day trial to see if they delivered as promised.

What we value most about using Fathom

As you probably already figured out, we decided to use Fathom analytics as our primary provider for collecting data about our visitors. So, what do we value most so far and how does this impact our users? One thing I really dislike about the web nowadays is the cookie consent dialogs we see all over the web. Because Fathom is cookie free, and we don't have any other cookies we don't need consent dialog. Only that feature makes me feel like , here take my money. Performance is also something that is really important to us and the script we needed to add is small and loads fast. Fathom also collects and showcases actionable data only, we don't need excessive reports, we just want the highlights, the key things about our website traffic so you can quickly adjust your content.

I hope you enjoyed this little story and that you learned something new. If you decide to walk the same path as we did, towards a more privacy-first website, give Fathom a try and see what you think.

Building a performance culture

Analysts at Portent found that conversion rates more than doubled when improving Page Load Speed from two seconds to below one second. They also found that if your Page Load Speed is over five seconds, the effect of speeding up the page load a second or two is close to none.

There are many practical tips on the web on how to speed up your online presence, such as adding CDN, minifying JavaScripts and so on, but I would like to add another angle to this topic. Before you can create a sustainable performance improvement, you need to create a performance culture within your organization. If you don't succeed with explaining why it’s important with speed and performance, you will end up with a project filled with quick fixes and employees that are happy just to have reached the short-term goal of the project. A year later you will most likely find yourself trying to fix all the performance issues that’s been created the past year. By doing performance fixes once a year your site will perform badly for eleven months out of twelve when you really needed a good performance every day for 365 days every year. By building a solid performance culture you have a good chance of getting things right from the start.

Here are some tips on how you can start building your performance culture.

Make performance count by doing your homework

Educate top management WHY speed matters. Without educated leaders you will not get the tools you need to succeed. Top management like figures and spreadsheets. It's quite simple to transform conversions to $ and there’s a lot of good examples of what speed can do for your revenue. Don´t forget to count the $ you will save by not needing to add an extra server when you web traffic increases.

Speed is a feature

When you create a feature and find a bug you will most likely fix it before launching. When a feature is working, but perhaps a bit slower than you hoped for, you might go ahead with the launch and decide to fix performance later. Don´t do that. Add optimizing for speed as a natural step in your developing process by adding a performance budget to your project. Set a maximum value for page loads for every webpage on your site or find your own KPIs that is relevant to your team and project. The key is making it measurable and actionable and to follow up as you develop new features.

Don't let time and customers get in your way

You probably have some guidelines and processes to follow in your team but when a customer needs that feature you are working on yesterday, the process is quickly forgotten. If you done the first and the second bullet above right, you will have a product owner or an executive holding your back, otherwise you’re left alone handling the customers demands. Stay strong and explain the importance of performance when a customer is aiming for your head.

Have a lightweight description of your process

It’s more easy to communicate with people if you have a simple way to describe how your team operates. For example, we like to use these three principles when explaining our process.

  • Make it work

  • Make it fast

  • Make it beautiful

Create a winning culture

Without winners in your team, performance will never be important enough. You can probably do okey without good performance, but you will not win any trophies with a poor performance. Winners always walks that extra mile. Give the team the confidence they need to win and explain why winning is important.

Find your competitor

Always try to improve by beating your latest figures but don’t forget to find a competitor to outperform. It’s a nice feeling when winning against a competitor even if the other part doesn’t know that you are competing.

Celebrate

Don’t forget to celebrate progress and do a retrospective once in a while where you spend some extra time talking about performance. It gives you energy for the upcoming work.

How to ensure performance

At Nimble Initiatives, we develop a platform where speed and performance are at the very core of the product. With no legacy we can add speed as a vital metrics without compromising. But how do we measure speed and how can we collect relevant data over time? And maybe more interesting, how are we performing compared to other technologies and services?

Measuring speed and performance can be quite tricky because you often have poor insights about the end user and the environment in which the user operates. Fortunately, Google has done a great job addressing this issue by introducing CWV (Core Web Vitals) and adding CWV to their PageRank algorithm on May 28,2020. One good thing with CWV is that Google helps us collect field data, and the Core Web Vitals Technology Report makes it easier for us to benchmark our own performance. In order to make it easier to measure and compare data Google has set boundary values for what’s a good performance, a performance in need of improvements and what’s a bad performance.

Today CWV conducts these three metrics:

LCP (largest contentful paint): The amount of time to render the largest content element visible in the viewport, from when the user requests the URL. The largest element is typically an image or video, or perhaps a large block-level text element. This is an important metric because it gives to the user a fast and good page experience.

FID (first input delay): The time from when a user first interacts with your page (when they clicked a link, tapped on a button, and so on) to the time when the browser responds to that interaction. This measurement is taken from whatever interactive element that the user first clicks. This is especially important on pages where the user is requested to perform any action.

CLS (Cumulative Layout Shift): CLS measures the sum total of all individual layout shift scores for every unexpected layout shift that occurs during the entire lifespan of the page. The score is zero to any positive number, where zero means no shifting and the larger the number, the more layout shift on the page. This is important because having elements shift while a user is trying to interact with the page is a bad user experience. If you can't seem to find the reason for a high value, try interacting with the page to see how that affects the score.

These measurements are evaluated against the following boundary values set by Google:

At Chrome Dev Summit 2021 Google revealed some new performance metrics for potential inclusion in Web Vitals down the road. They are: * Responsiveness – the idea is to better capture the end-to-end latency of individual events and offer a more holistic picture of the overall responsiveness of a page throughout its entire lifetime * Smoothness –this metric will capture how smooth content animations and scrolling works on the site

Core Web Vitals Technology Report

Let’s check the performance metrics for React which is one of the most common JavaScript libraries on the market. Out of 518901 tested 31,8 % having good Core web Vitals on desktop, and 24,5 % having good Core web Vitals on mobile. Even that it is possible to create a fast web site using React it’s sad to see that 3 out of 4 fail delivering a good user experience on mobile devices.

If we check with some of the most common CMS, the picture is almost repeating itself, but the vendors are working hard for hitting better scores. In this case Wix has done huge improvements this year. And once again, you can’t determine by this graph which CMS delivering the best Web Vitals. This is only a summary, and we believe you can build a well performing website using any CMS, but at the same time it puts a finger on the ecosystem related to each CMS. Also note that this figures doesn’t measure the editor environment, that is a completely different story.

Bootstrap is another common framework used by millions around the world. 36,1 % on desktop and 28 % on mobile are having a good experience.

What's our take on Core Web Vitals?

In total Core Web Vitals are good metrics. When building our own platform, we are constantly monitoring our Core Web Vitals. It’s one out of many tests we do constantly. But a platform’s performance will only take you so far, you still need to build your own solution based on any platform. That’s why one of the keys for us is to never hinder developers in any way from doing their own magic. Our biggest take on performance spells knowledge and that’s why you will be able to use whatever technology you like when building your solution using our platform.

Conclusion

Google is making the web industry invest in the know-how of user experience, by defining the standard for good performance and adding boundary values to the metrics, including them into their PageRank algorithm. They give us the tools to learn and the ability to benchmark our progress with colleagues in the market. But remember, even a good technology/platform can be messed up so make sure to test your performance continuously or work with a well trusted partner.

Further reading

Does your website contribute to global warming?

The Carbon footprint of our daily internet habits accounts for 3,7 % of our global greenhouse emissions. It is at the same level as the aviation industry and these emissions are predicted to double by 2025. The global IT sector electricity demand ranks number 3 behind China and US and it's estimated that communication technology will use 14 percent of global electricity by 2040, up from just under 4 percent in 2020.

So how much pollution does your website contribute with? There is an easy way to get that information, just enter the URL to your website at websitecarbon.com and you will get a quick overview of your performance.

An average web page produces 1.76 grams CO2 per page view. For a website with 10,000 monthly page views, that's 211 kg CO2 per year.

Okey, I get the point. My website contributes to the global warming but what can I do about it? We run a business and we need to have website with lots of visitors. That is kind of the purpose having a website.

In the context of digital services, we believe speed is one of the key solutions reducing our emissions and saving our planet from global heating. Speed doesn't only save our planet, it also adds a lot more advantages to your business and your customers. We have listed some of the advantages below.

Upsides with speed

When we started developing our new platform, we put speed as a top priority. How can we build a web-based platform without any spinners and constant waiting? When we were talking about speed, we started leaning towards how much weight (Kbyte) we needed to transport and that led to investigating the upsides with a Fast & Furious UI. If you are focusing on creating a fast website you will get a positive side effect, your site will produce less energy because you are decreasing the weight of your web pages, simplifying the complexity of your site and lowering the physical distance between your servers and your main audience. Besides decreasing our environmental impact, we found a lot of other short-term benefits as well.

  • Speed is a feature. It gives the user a feeling of productivity and in the end a more enjoyable user experience.
  • Ranking higher on Google. Google ranks fast websites higher.
  • Built for scale. The solution to a bottleneck doesn't have to be scaling up the hardware. It's time for a different approach and to minimise the data. From 2017 to 2021, the median size of a web page increased by roughly 40-45 percent and the amount of JavaScript increased with 50 %. Have the websites really gotten 40-45 percent better?
  • Complexity. Less code equals less complexity, and it leads to a more stable product with less bugs.
  • $ saved. When it comes to money saved, there is a huge upside. Calculating the potential money saved in the cloud demands hard work. You need to do your own math but bandwidth is one simple parameter driving cost, but you can save big numbers if reducing hardware and the use of different services in the cloud.

We think it's time for a paradigm change where we start building our digital services for speed! Everyone is the winner except perhaps the cloud vendors. If you are creating digital services, be sure to build for speed and if you offer digital services to customers, be sure to add speed to your feature list.

We will continue to publish our thoughts and knowhow on this topic in our upcoming posts. Who knows, it might be a little more practical and techie.

Stay tuned!

Further reading

  1. bbc.com - Why your internet habits are not as clean as you think
  2. sciencedirect.com - Assessing ICT global emissions footprint
  3. websitecarbon.com
  4. httparchive.org - Page Weight

Good Vibes! Our Team is Growing, and we are Live with our First Internal Release!

First, we want to welcome our newest team member onboard! Frontend developer and UX designer Christian Andersson is the fourth player on the team and in just a few weeks together with the rest of us, he's started to create an awesome concept of the UI that we are all really excited about! We can't wait to share this with all you guys so stayed tuned for an upcoming sneak peek!

Second, we have closed our first development cycle called "Sensations" and our website nimbleinitiatives.com is now spinning nice and smoothly on our own platform. Once we're finished with our next cycle "Patterns" we are hoping to launch for a first closed technical beta. Interested? Give us a holler!

What is Holding Space?

So what does it mean to hold space? It is a profound phrase, used in a vast range of areas ranging from philosophy to organisation management. Holding space means being present, open, allowing, and protective of the needs of others. If you haven't heard the phrase before, make sure to look it up, there are several interesting articles on the subject.

At Nimble Initiatives we believe that holding space is the very key to stimulate innovation and unleash the full potential of both an individual and an idea. By having trust in self-organisation and resist the urge to control the creative work of others we believe that great things will come your way.

That's why all our initiatives get total freedom and anyone who feels drawn to the idea can contribute in any way they see fit. So we hold space and let the team work their magic.

And please enjoy Harrison Owen's beautiful and vivid explanation of Holding Space

"Holding space is an act that is at once totally present and totally invisible. It is, like the Tao, an activity that is characterized by paradox. Holding space is about resting in the trust that self-organization, that force which created the universe and brought us to this point, will continue to work its magic. To prepare yourself to submit to the power of self-organization, you must let go of outcomes. You must breathe life into the principle that "whatever happens is the only thing that could have happened." We learn to let our desires fall away and confront what is present in the space, and what is real and living before us. To hold space is to rest in the chaos that is darkness; a darkness that represents a vast field of unknown potential. It is this field that you are inviting to hum. From this field understanding will blossom, light will emerge, possibilities will grow."